Sunday, April 08, 2007

CSharp (C#) Control Component - Moving Graph Control

Programming Language & Tools: Microsoft .NET C#
Year: Apr 2007Testing Application: Download
Source Code : ahyeek@gmail.com

Have you ever think to have a CSharp (C#) control that allow you to store and display your scientific calculation values computed from your research application? No doubt, if we can represent our numrical scientific calculation data in graph format, it will increse the efficiency in our research in term of examine the correctness of our algorithm as well as methematic models.
This Ver 1.0 graph component is build to cater this purpose. Below is the list of the avaialble features:
ExMovGraph Ver 1.0.0.0 Features:
  • Allow user to input 3 set of values at 1 time and display them on the graph. Each graph can be represented by using different colors. This enable user to compare 2 to 3 set of scientific calculated values under the same scale.
  • Allow user to set a graph scale (can take negative (-ve) value and minimum scale and positive value as maximum scale). For example, [-1 to 1].
  • Enable to turn on and off the horizontal and vertical grid display. User are allow to set the color and gap (in pixel) for the grid.
  • Enable user to set the size of the graph' drawing line.
  • Display total number of graph's point currently available in the graph component.
  • Allow user to set for auto scroll the graph display (display the latest input graph point) or scroll to the previoius or any portion of the graph at anytime. (By turning off the "Auto Scroll" indicator)
  • Allow user to set their own graph title with the color they like, as well as the scale display color and graph border color.
  • Allow user to set the graph display format, either as point form or as line form.
  • Allow user programatically clear the graph data or other graph properties setting at anytime.

A testing program of this graph components are available for download. Please feel free to test it out and post the author some comments. If you wish to use the component, please drop an email to the author.
P/S: Do not hesitate to email the author if you have any special idea or enhancement features you think you like, the author will get it implemented in the future version. Thanks!

Monday, December 18, 2006

Learn CSharp (C#) Lesson 3

Year: 2006
Example Code: Download
  • How To Create Event Handler For A Control.
  • How To Add / Remove Event Handler At Running Time.
  • How To Use Status Bar.
  • How To Implement Control Events.
  • How To Use ListBox Control.
  • How To Use GroupBox And Panel Control.
  • How To Use ToolBar And ImageList Controls.
  • How To Create And Using ToolBar Control.
  • How To Implement Drag And Drop Operation.
  • How To Let TreeNode Selected When Drag Over To Add An Item As TreeNode.

Learn CSharp (C#) Lesson 2

Year: 2006
Example Code: Download
  • How To Create A Form, Set Form Properties, Form Life Cycle, Form Events, Designer Generated Code.
  • How To Create A MDI Application.

Learn CSharp (C#) Lesson 1

Year: 2006
Example Code: Download

  • How To Create A Form, Set Form Properties, Form Life Cycle, Form Events, Designer Generated Code.
  • How To Adding Controls To A Form.
  • How To Add Menus To A Form.
  • How To Customize The Controls Toolbox. (Status Panel Bar).
  • How To Organize Controls On A Form.
  1. Anchor Examples.
  2. Dock Examples.
  3. Set The Tab Order For Controls.

Monday, July 17, 2006

Research On Try-Catch-Finally Model Work

Year: 2006
Example Code: Download

This example is to test how the Try-Catch-Final architecture work.

Specified scenario to check on:
To test will the FINALLY statement in the TRY-CATCH block is still being executed if we issued another THROW statement in the CATCH block before the code reach the FINALLY block.

The answer: YES

**Note:
This is the simple research that I have completed and shared with my Intel development team. A simple award recongnition was given by the team member:


Saturday, March 11, 2006

Genetic Algorithm (GA) In Solving Vehicle Routing Problem

Year: 2005 - 2006
Programming Language & Tools: Microsoft .NET C#Source code / Request for customization: http://www.geneticalgorithm.biz/
Application For Test: Download


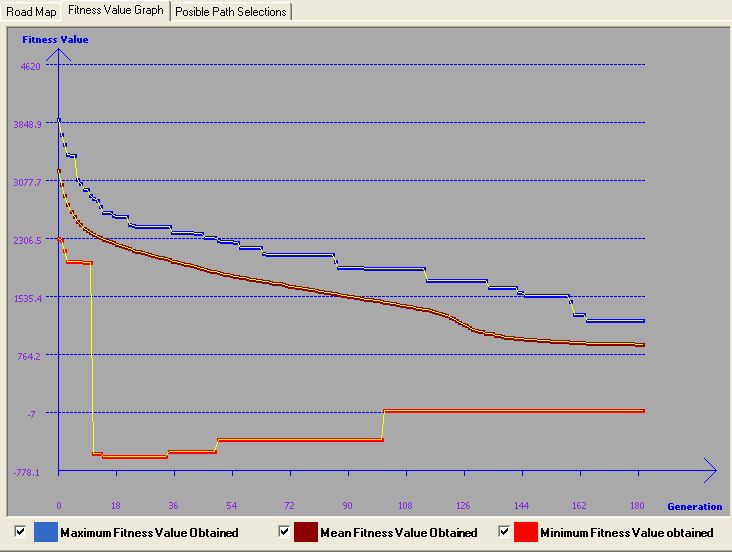
This simulation was developed to learn Genetic Algorithm and coded in Ms. Net C#. The problem that the author faced was to solve the vehicle routing. In order to implement and visualize how GA perform in solving the problem, the simulator was impemented with a random generated map. Users can actually provide the number of locations he/she wants and how many roads connect to each location, then the map generator will generate a map with the corresponding setting.
Several parameters need to be provided before performing the GA to solve the problem. The parameters are basically the GA needed parameters, such as Population size, Cross-Over Rate, Mutation Rate and Number of Generation. User need to determine the source and destination on the map before simulate the solutions. The system finally will give a path that connect the source and destination location as well as the distant and time using the path. The goal is to get the shortest and fastest route for travel from source to destination.
Furthermore, the simulator actually build in another algorithm - Dijikstra Algorithm. This algoritm is the best and fastest algo in solving shortest path problem. It's actually used to compare wtih GA in solving a specified situation. Simulator also build in with all potential path generation mechanism, but it depend on maps and the source and destnation location that user choose. Sometimes, it will take long time to get all the posible paths generated. However, this mechanism is actually implemented in a thread manner that user actually can generate the potential path and let the simulation run synchronizely.
There are a lots of other useful an interesting features implemented in the simulator and the author think it will be too much to state here. So, let download the system and try it! You will discover more....

Biological Cell Model On Grid Computing

Year: 2005 - 2006
Programming Language & Tools: Microsoft .NET C#, Alchemi
Addtional documentations :

  • Cell Grid Computational System Flow Download
  • General Presentation Of Cell Grid Computation System and Alchemi Download

Simulation System Flow:

  • Construction Data Structure Of Cell Model
  • Initialize Timestep For Simulation
  • Distribution Cell Computational Tasks to Executor Node(s)
  • Computational Tasks Of Each Cell Are Executed
  • Collect Computational Results From Executors
  • Update Computational Results For Cell Model
  • Increase Timestep to n+1
Biological Cell Model On Grid Computing Conceptual Diagram:

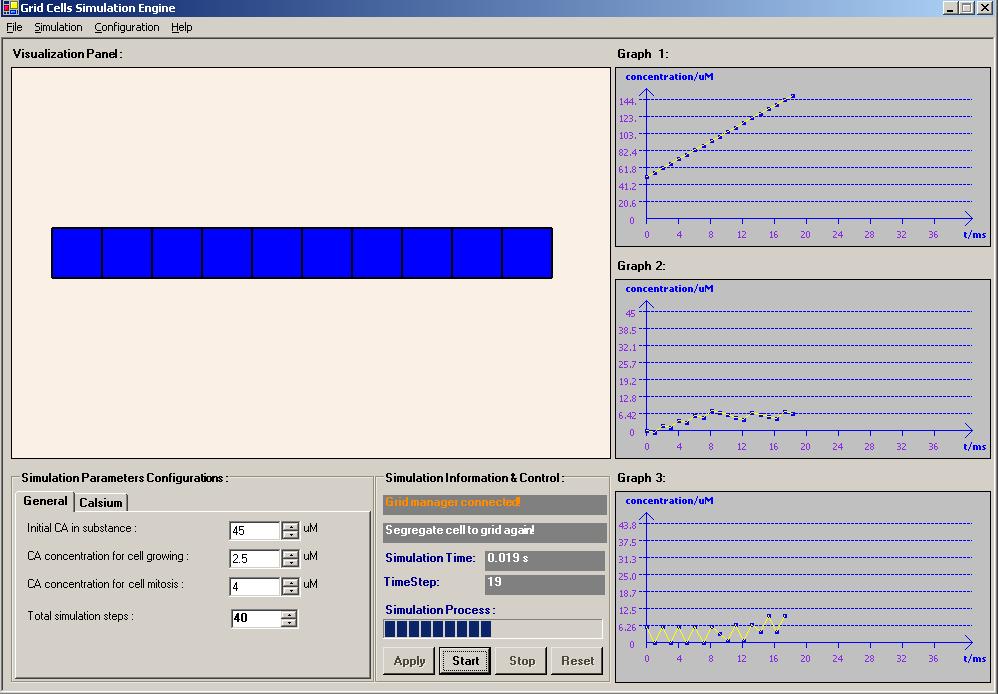
Cell Grid Simulation Engine:

Tuesday, March 07, 2006

Dynamic Cardiac Mechanics Based On Fiber-Fluid Model

Year: 2004 - 2005
Programming Language: OpenGL, C, C++, Titanium
Award:

  • Gold medal award of the Invention Exhibition of New Invention, Techniques and Products 2005, Geneva, 8 April 2005.
  • ITEX Bronze Medal award of the 16th International Invention Innovation Industrial Design & Technology Exhibition 2005 (ITEX 2005), Kuala Lumpur, Malaysia, 19th-21st May 2005.
  • “Saintis Cemerlang 2005” awarded by Ministry of Higher Education, 23 August 2005.
  • Gold Medal award of the IPTA Expo 2005, PWTC, 2 October 2005.
Thesis : Download
Master Presentation: Download
OpenGL Source Code acquisition: Email toahyeek@gmail.com
Published Journal:
  • N.Selvanathan, S. Y. Tan, S.Nagappan and M.Sankupellay. “The fiber-fluid model of the human heart”. Journal of Science & Technology in the Tropics, Vol 1. No. 1, Jun 2005.
  • S. Y. Tan, Selvanathan Narainasamy, Somasundaram Nagappan. “NON-INVASIVE METHOD FOR PATIENT-SPECIFIC VIRTUAL HEART BASED ON FIBER-FLUID MODEL”. Journal of Mobile Multimedia, Vol 2, No 1, 2006: pp052-080.
RESEARCH OVERVIEW - Research Framework
  • Virtual Human Heart allows:
    • Heart Surgery Planning
    • Training of Cardiologist
    • Drugs Testing
    • Detailed Diagnostics
    • Education of Cardiologist

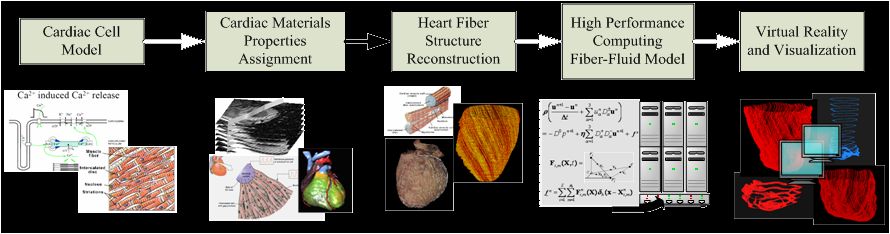
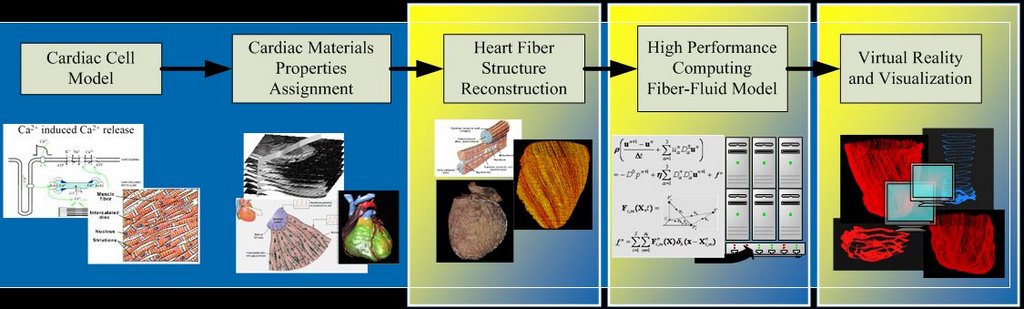
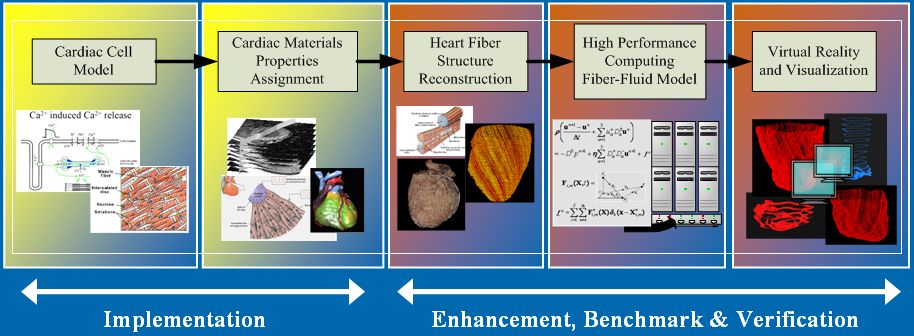
Research framework for virtual heart model undertaken at University Malaya [1]:
[1] N. Selvanathan, Sieow Yeek Tan, Somasundaram Nagappan, Mangalam Sankupellay. (2005). The Fiber-Fluid Model Of The Human Heart. J. Science and Technology in the Tropics, Vol 1.

RESEARCH SCOPE
  • 3D Rule-based cardiac fiber reconstruction mechanism.
  • Immersed Boundary Method for fiber-fluid model.
  • Titanium for distributed and high performance computing.
  • OpenGL technologies for Visualization.
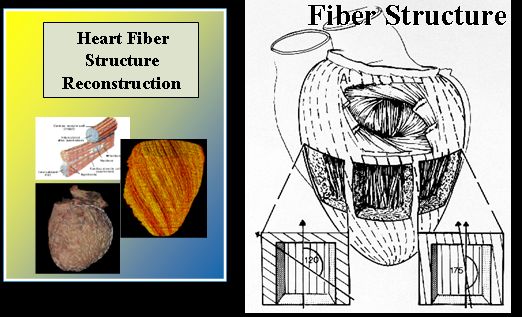
INTRODUCTION - Rule-Based Cardiac Fiber Reconstruction
  • Novel technique : 3D Rule-based fiber orientation reconstruction.
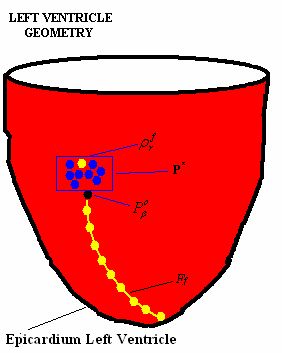
  • A single fiber consists of a set of fiber points.
  • The fibers are constructed from a set of points (material points from epicardium) by registering them into a fiber.
  • The selection mechanism of a registered material point will influence the constructed fiber sheet architecture.
  • The mechanism is controlled tightly by a set of pre-defined rules that has been related carefully based on the formation of the fiber orientation.
  • The rules take into consideration of:
    • Fiber orientation angle
    • Direction of fiber path
    • Overlapping between two or more fibres
    • Duplication in registered fiber points
[1] Fox and Hutchins (1972). Johns Hopkins Med. J. 130(5): 289-299.
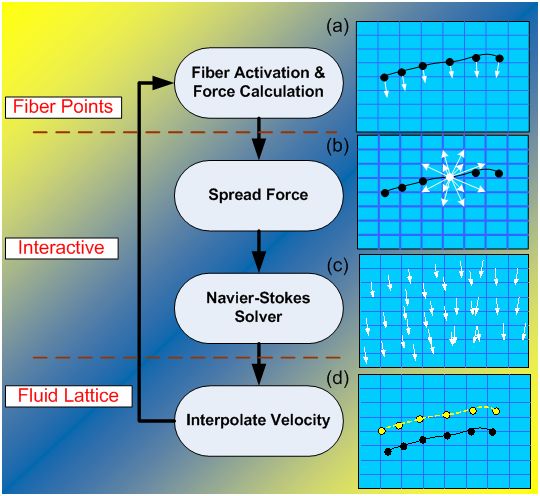
INTRODUCTION - Immersed Boundary Method
  • Proposed and developed by Charles Peskin and David McQueen.
  • General numerical methodto efficiently simulate systems that are represented by elastic fibers immersed in an incompressible fluid [1].
  • Fibers are considered as elastic material.
  • Blood can be treated as a Newtonian fluid.
[1] Peskin, C. S. and McQueen, D. M., 1995. A general method for the computer simulation of biological systems interacting with fluids. Symposia of the Society for Experimental Biology, Cambridge, UK, Vol. 49 pp. 265-276.
INTRODUCTION - Visualization
  • An important concept to display the simulated results on the computer screen.
  • Translate numerical results into complex 3D objects.
  • Interactive computer graphic is required during the model design and result analysis [1]:
    • 3D objects can be animated, rotated, turned on and off.
    • Magnify into any region of interest.
  • [1] McQueen, D.M and Peskin, C. S. A Three-Dimensional Computer Model of the Human Heart for Studying Cardiac Fluid Dynamics. ACM Siggraph, 2000, Vol. 34 No1.
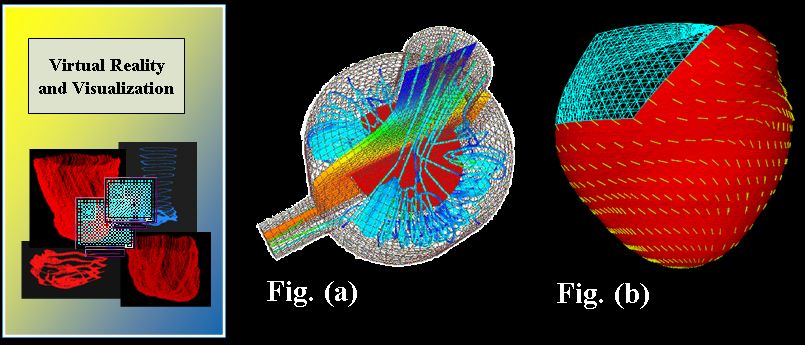
Application of visualization techniques:
  • Description of Fig (a) and (b):
  • Displays the fluid flow and temperature distribution in a reactor.
    • Fluid flow is represented as vector data (ribbons) and temperature as scalar data (colors).
  • Displays fiber direction (yellow).
Methodology Outline
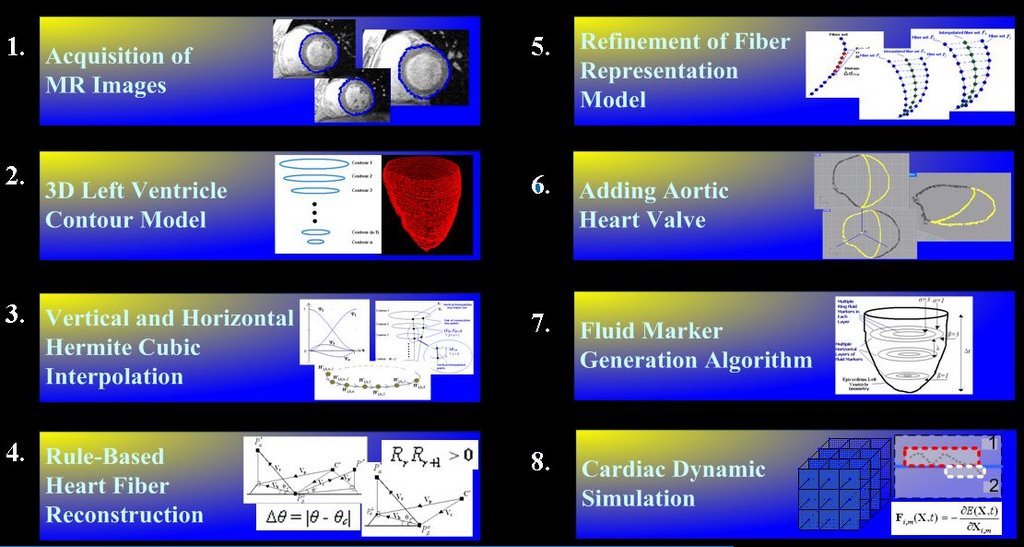
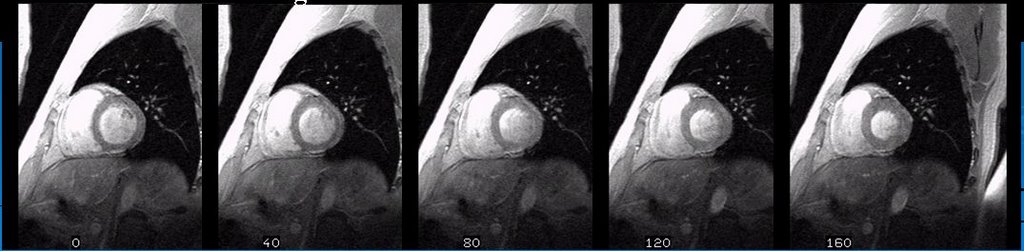
Acquisition of MR Images
  • A set of high-resolution 2D MR images were obtained from a volunteer (27 years old healthy man) on breath-hold LV at the starting of systolic stage.
  • Volumetric images are scanned based on T1-weighted Magnetization Prepared Rapid Acquisition Gradient Echo (MPRAGE) images with the dimension 256 x 256 x 16.
  • Materialise Software “Mimics” was used to help in obtaining the images from MOD disk.
  • Some selected MR images are shown below:
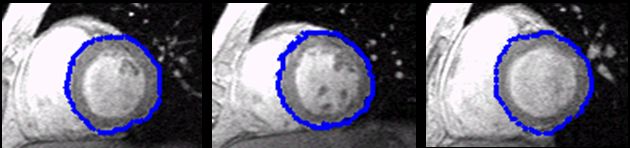
3D Left Ventricle Contour Model
  • Segmentation:
    • Image pre-processing to reduce image noise.
    • Filtered a series tested of threshold values.
    • Edge detection algorithm to identify and extract the ROI (LV).
    • Segmentation algorithm using Active Shape Model (ASM).
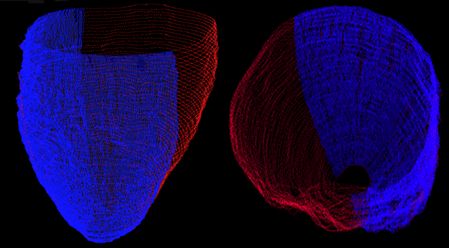
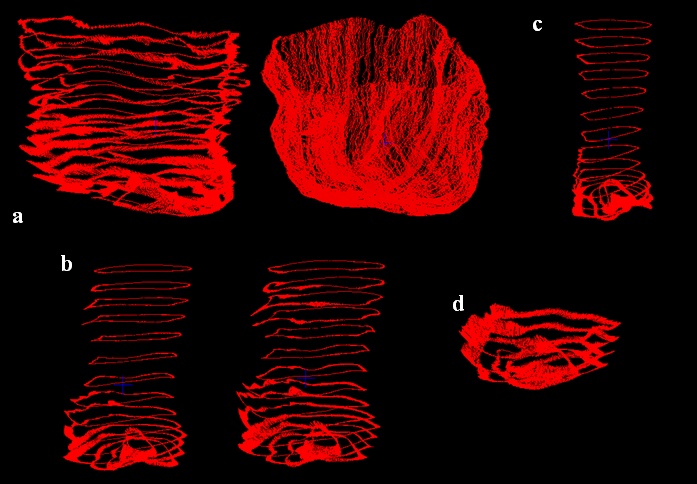
  • 3D contour model:
    • Stacking all the contours (Fig. a).
    • Transform all the 2D contour points into a 3D Cartesian coordinates.
    • Scaled and translated the model to the centre of 64 x 64 x 64 3D experimental space (Fig. b).
Vertical Interpolation
  • VI key points set is a set of key points identified throughout all the contours, noted as (K1).
    First key point is identified in contour 1 (P
    1).
  • Evaluate the minimum distance between P1 and the key point on the contour 2 (P2).
  • The same procedure is repeated till contour n.
  • The VI points for set K1 is obtained by interpolating all the key points from P1 to Pn.
  • The figures show the vertical interpolation process is being executed and the screenshots were captured from different points of view.
  • Blue color points represent the vertical interpolated points while the contour points are in red color.
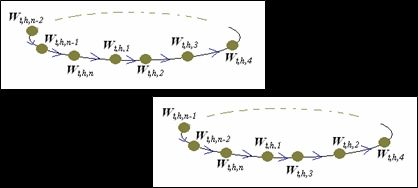
Horizontal Interpolation
  • Key points are identified from vertical interpolated points.
  • A maximum set of horizontal key points for each gap is fixed based on the maximum vertical interpolated points available in that gap.
  • The point’s index in a horizontal key points set are arranged into a ‘ring’ manner.
  • Figure below show the horizontal interpolation process was executing which captured from our visualization program from different points of view.
** Detail interpolation demo can be downloaded from here and view vie IE. (Note: Drag the downloaded GIF file to your IE or Open with your IE.) Download
Rule Based Cardiac Fiber Reconstruction

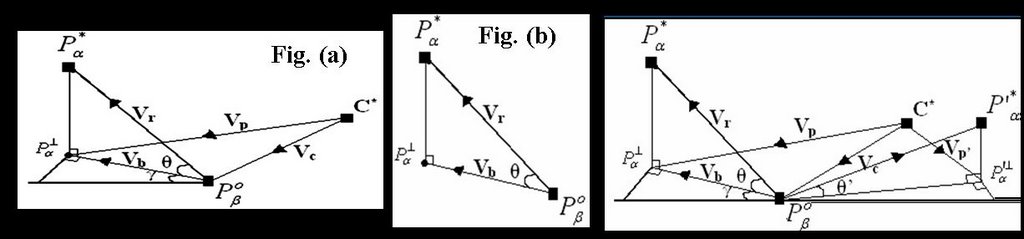
  • Rule and algorithm schematic. Please refer to the presentation, thesis or published paper for understand the fiber construction algorithm.
  • Figure above show the required data representation in forming a single heart fiber in 3D environment and the model.
  • Figure (a) and Figure (b) is the schematic to show how the fiber angle was formed in 3D space.
  • Fiber path and fiber direction schematic. (Third figure).
  • The author has faced difficulties to get the complex set of mathematic equations to be published on HTML web page. Please refer to the Master Presentation or Theis for the detail algorithm in constrcuting the heart fiber direction.

Refinement of Fiber Model
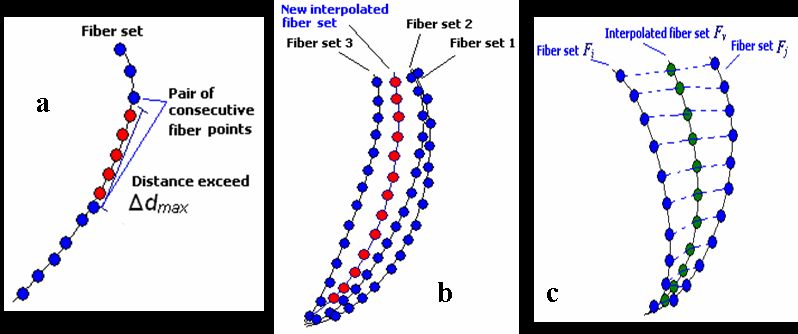
  • Fiber-Point interpolation:
    • Every pair of consecutive fiber points in each fiber list has varying gaps between each other.
    • Some of the large gaps may cause inaccuracy during cardiac simulation.
    • The gaps for each pair of consecutive points is needed to be limited to a reasonable distance.
    • Applied to generate additional points in order to refine the fiber model (a).
  • Fiber-Based Least Mean Square analysis:
    • A fiber set will be removed if the fibers are too close to each other (b).
    • When gap exists between two adjacent fibers is huge, a new fiber set need to be constructed (c).
    • Fiber-Based Least Mean Square (FB-LMS) analysis on all pairs of adjacent constructed fiber sets.
    • The LMS value of two adjacent fibers set is used to identify whether the two fibers are too far or too close from each other.

** Detail fiber construction demo can be downloaded from here and view vie IE. (Note: Drag the downloaded GIF file to your IE or Open with your IE.) Download
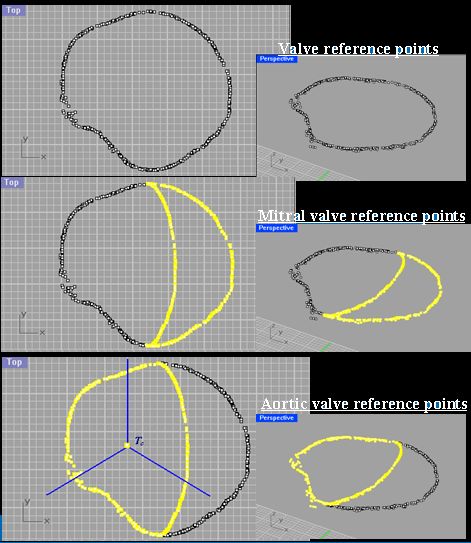
Adding Aortic Heart Valve

  • A set of points from the constructed fiber model is obtained to act as the reference points.
  • Adding the aortic valve to the fiber model aim for obtaining more realistic cardiac simulation results.
  • Concentrated to build the aortic valve model.
  • Obtained from the first point in each of the fiber set from model Ĥ.
  • Generate the centre set of reference points from the original valve reference points.
  • Combine the centre set of reference points to the valve reference points on the right hand side to form the mitral valve’s reference points.
  • Combine the centre set of reference points to the valve reference points on the left hand side to form the aortic valve reference points.
  • Divide the aortic valve reference points to three segments. Each segment is 120o sector.
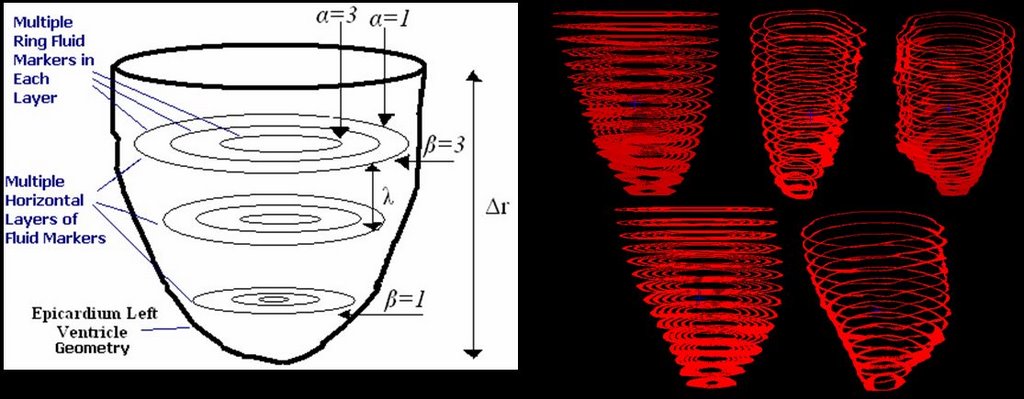
Fluid Marker Generation
  • Fluid marker is a set of fibers which they do not contribute any forces during cardiac simulation.
  • Their movement will be influent by their surrounding fluid.
  • Used to analysis the blood movement inside the LV chamber.
  • Conform in terms of physical location within the constructed fiber model.
  • Fluid markers are generated at multiple horizontal layers, each layer consists of multiple rings.
  • Analyze the fluid dynamics at different locations in the LV chamber.
Visualization - Environment and Programs
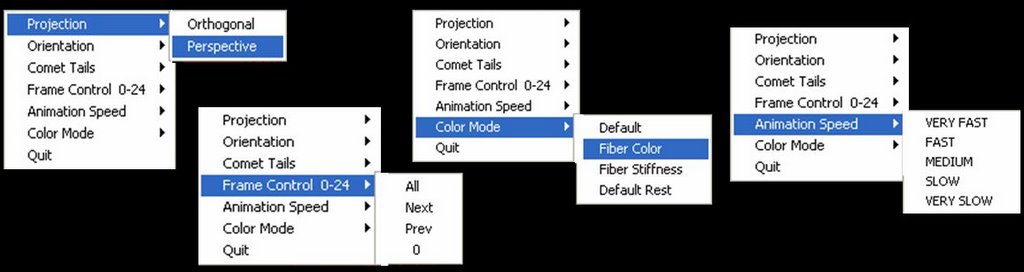
  • Developed a series of visualization programs.
  • Equipped with interactive computer graphics features .
    • Toggle appearance of fiber in our heart model in real time.
    • Interactively change our point of view.
    • Rearrange data sets in frame by frame manner to produce animation effect.
    • Allow us stop at a certain frame that we are interested.
  • ØVisualize the simulate processes of fiber reconstruction mechanism.
    • Verify the constructed fiber results in real time.
    • Significant advantage: allows observation and modification of rules and simulation parameters setting.
  • OpenGL Utility Toolkit (GLUT) 3.6. and C programming language.
    • Compiled to run in Irix 6.5.13, SGI workstation, 2.4 MHZ Processor speed, 2GB of memory space.
Results
Rule-Based Cardiac Fiber Reconstruction

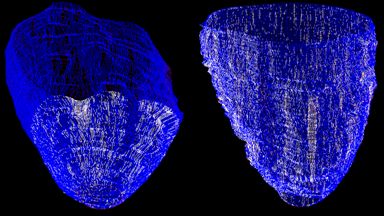
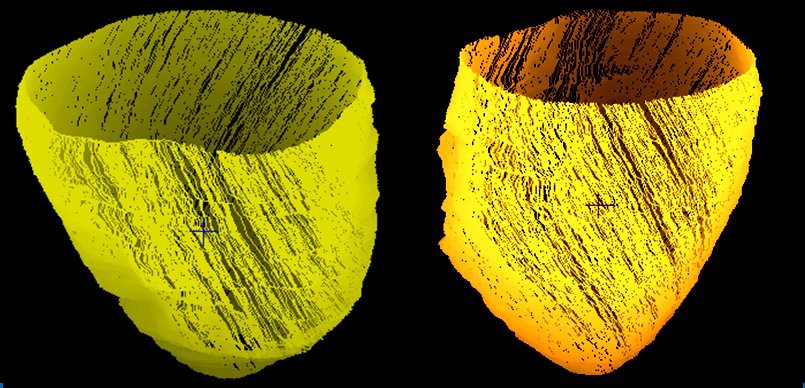
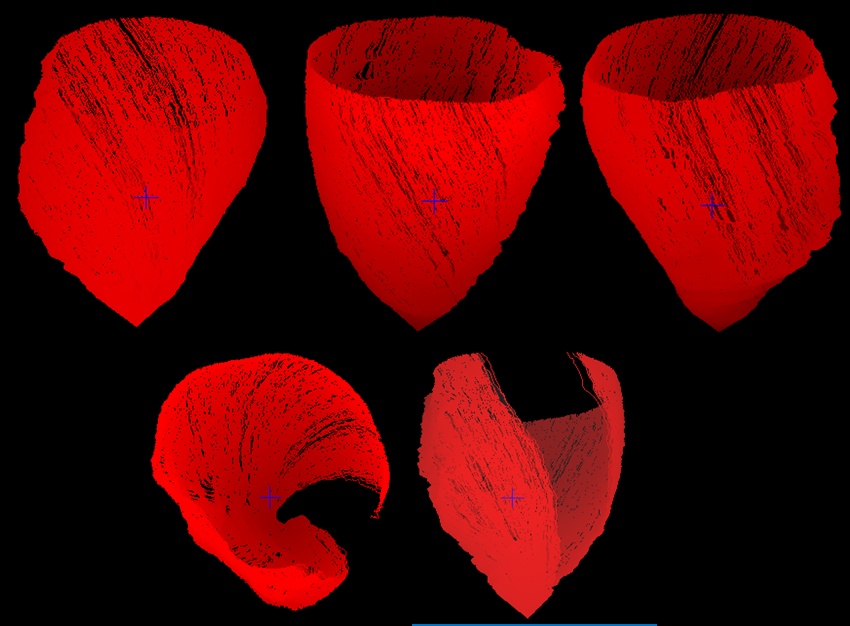
  • ØReconstructed Cardiac Fiber model shown without the model points.
  • 1,200 fibers (yellow path) which contain 584,589 registered fiber points.
Refinement Of Fiber Model
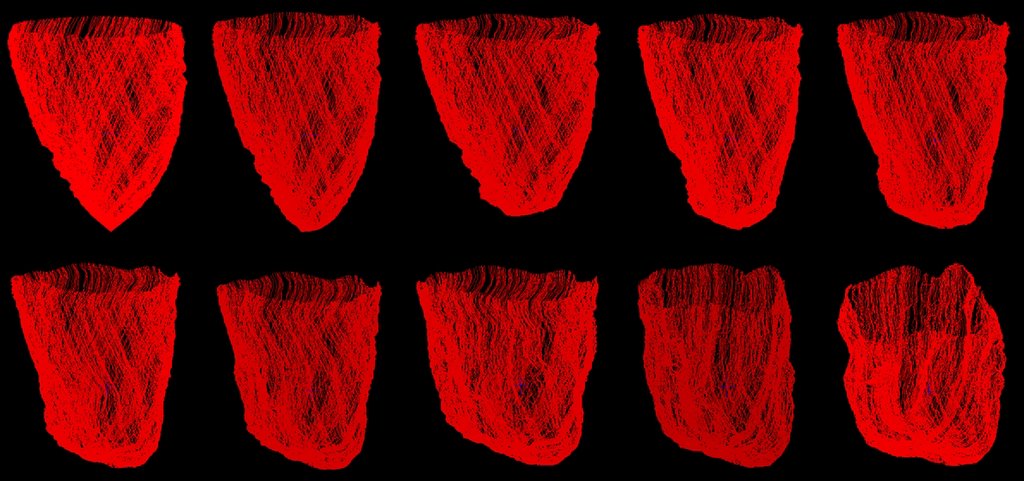
  • ØFiber model is constructed by 1,038 fibers with the total of 371,658 fiber points after the refinement processes.
  • ØModel is captured from different point of view.
  • ØFiber model with some of the fibers turn off in order to view inside of the heart chamber.
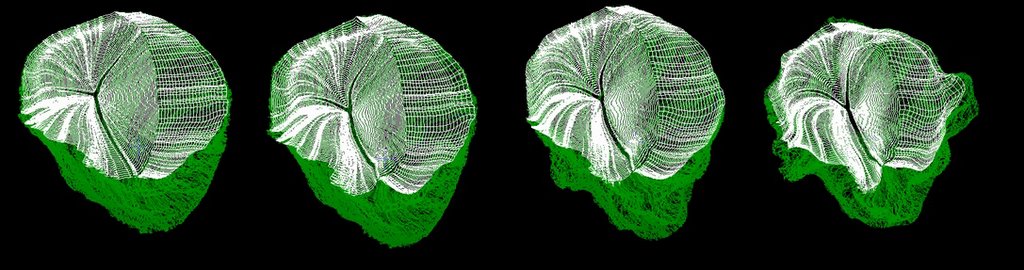
Aortic And Mitral Valve Fiber Model
  • a.a) The constructed mitral valve fiber model shown in different point of views.
  • b) b.Mitral valve fiber model location relative to aortic valve fiber model.
  • c.c) The location of the valve fiber model (white) relative to the whole LV fiber model (green).
  • d.d) First, second and third segment of aortic valve fibers together with the full aortic valve fiber model by combining each of the aortic segment.
Simulation ResultsCardiac Fiber Simulation

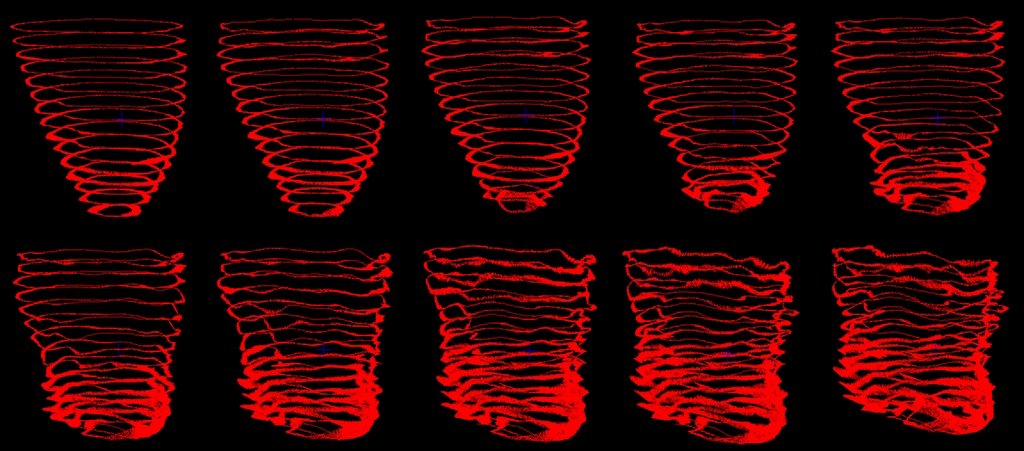
  • ØImmersed Boundary Method applied, simulate 1024 time step consumed approximately 11 CPU hours.
  • ØFigures show the dynamic of LV cardiac muscle for each 0.05ms start from the beginning of ejection stage. Arranged from left to right for first and second row.
Blood Flow Simulation
  • The mechanics of blood flow in LV for each 0.05ms start from the beginning of ejection stage. Arranged from left to right for first and second row.

Aortic Valve

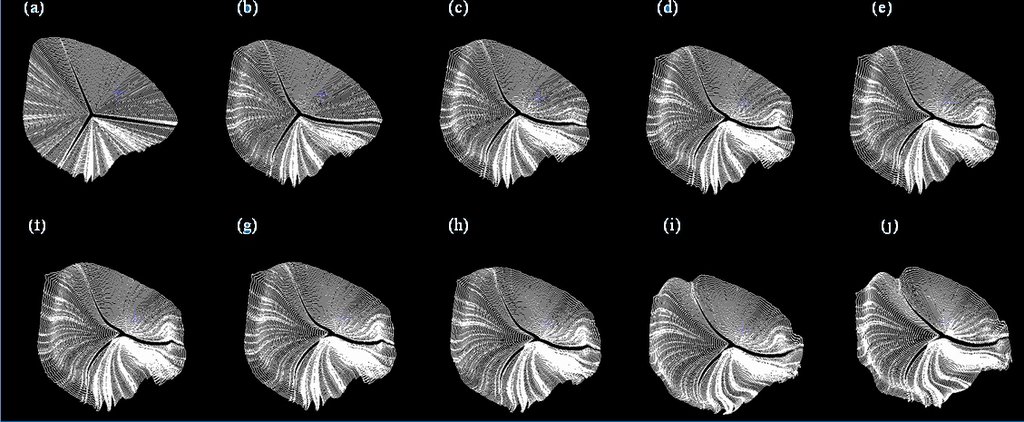
  • Aortic valve fiber dynamic start from early ejection for LV chamber. From (a) to (j), each frame represents the mechanics of simulated fibers muscle at different physical time. Start from 0.05ms for (a) and increase 0.05ms for the next. (j) shows the fiber dynamic at 0.5ms.
Fiber Model And Aortic Valve

  • The entire LV fiber model, including the valves fibers (white) and cardiac muscle fiber (green).

Result Analysis
  • a.a) The mechanics of blood flow nearest to the LV wall together with the cardiac fiber dynamic at the time 0.5ms.
  • b.b) 2nd and 4th layer of ring fluid markers from each of the horizontal layer at 0.5ms respectively.
  • c.c) The innermost ring fluid markers from each of the horizontal layers at 0.5ms.
  • d.d) Several selected horizontal layers (outermost ring) of fluid markers which located near the apex of LV chamber.
  • Observed that there are not much movement of blood at the middle of the LV chamber while the blood flow near the LV apex and the LV wall has a high expulsion.
Future Work
  • Cardiac Material Properties.
  • Myocardial Activation.
  • Cardiac Cell Model.
  • High performance computing on:
    • ØFiber-fluid model.
    • ØRule-based fiber reconstruction mechanism.
  • Fibrous-sheet structure.
  • Visualization system.


Simulation Results Materials for Download:

(**Note: For GIF files, you can open it in IE. For .MOV file, please download quicktime player for view it.)
Fiber_Construction_Movie

  • The heart fiber construction process for the total number of 550 fibers. Download
  • Others completed fiber construction movie (1700 fibers constructed). Download
Heart_Fluid_Marker_Movie
  • The fluid marker located near the apex of LV chamber simulation. The fluid markers are selected from 5 bottom horizontal layers and it is the outermost ring. Download
  • The fiuid marker located near the base of LV chamber simulation. The fluid markers are selected from 8 horizontal layers from the top and it is outermost ring. Download
  • The simulation of blood flow in LV chamber during systolic. All markers (all horizontal layer & rings) are turn on and the movie is captured (FullMarker.mov ). Download
  • Same as FullMarker.mov simulation but with different view of perceptions are captured. Download
  • Same as FullMarker.mov simulation but movie captured while horizontal view perceptions is changing. Download
  • Fluid marker simulation with only the inner most rings for all horizontal layers are turn on. Download
  • Fluid marker simulation with only the ring 3 and ring 4 for all horizontal layers are turn on. Download
  • Another fluid marker simulation with Ring 3 and Ring 4 for all the horizontal layers are turn on. The 8 horizontal layers of ring 2 are also turn on. Download
  • Fluid marker simulation with all outermost rings for all horizontal layers turn on. Download
Valves_Related_Movie
  • Simulation of the heart fiber contraction with valve attached. Download
  • Simulation of the tricuspid valve. Download
  • Simulation of the valve including the dummy aortic valve is turn on. Download
Interpolations Images
  • Contain images show the cubic Hermite vertical and horizontal interpolation process and results. Download

Friday, March 03, 2006

INFONERVE - Your Millennium Knowledge Repository (Online Multimedia Library Management System)

Programming Language: ASP, MySQL, COM+, Javascript
Brochures : Download
LIBS Presentation: Download
OMMS Presentation: Download
More information needed? Contact: ahyeek@gmail.com

INFONERVETM is a web-based online library and knowledge management software solutions, aims to provide an ideal solution to transform your library into digital information portal.
Project Missions:
  • Fasten deployment and digitization to help transforming traditional libraries into digital multimedia virtual libraries.
  • Empowering libraries to offer substantial information resources, allowing users to search, access and retrieve it in a seamless manner.
  • Connecting people, libraries, and information at anywhere, anytime, 24 hours a day, 7 days a week.
Leveraging with comprehensive features on cataloguing, circulation, periodical, OPAC search, personalization, user management and authentication, INFONERVETM facilitates library automation and effective information management for your library.
INFONERVETM shape the solution based on 19 key features:
1) User Authentication
  • System access control to authorized users
  • Configurable feature links to authorized users
  • Patron account expiration reminder


OPAC
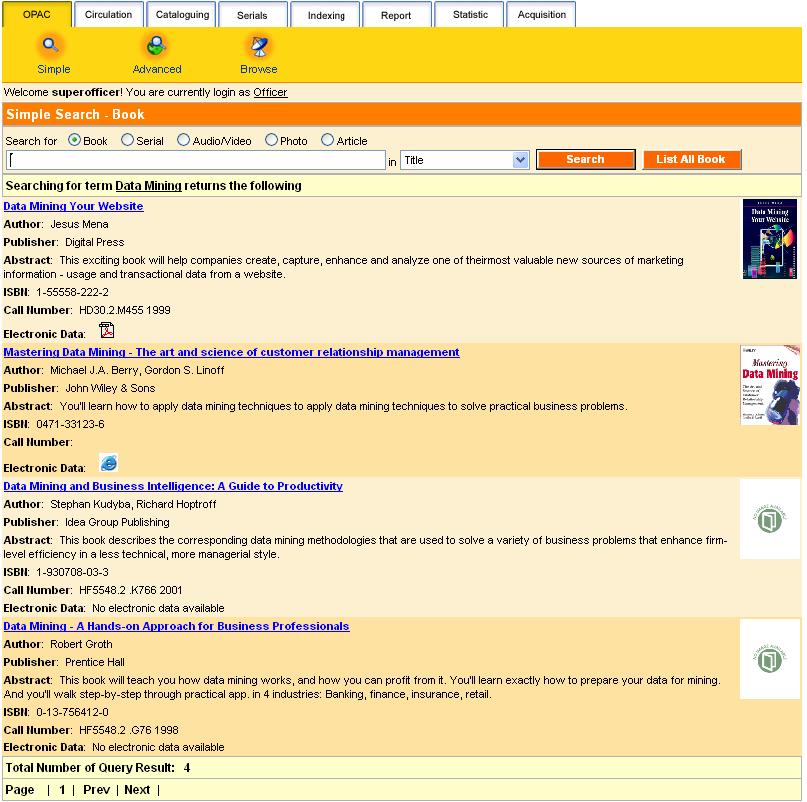
  • Online/LAN access to library catalogue
  • Web search
  • Provide inquiry for item details and status
  • Quick search – selected field searching
  • Advanced search – boolean searching for combination of fields
  • Browse search – alphabetical list of field heading searching
  • Personalized search preference
  • Staff/Patron mode search result


Multimedia OPAC
  • Book
    • Cover display
  • Serial
    • Cover display
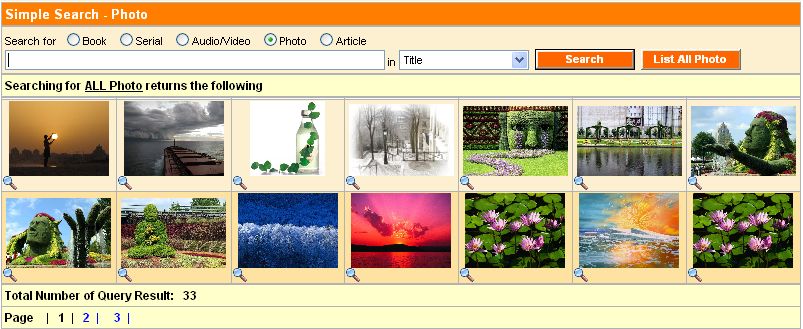
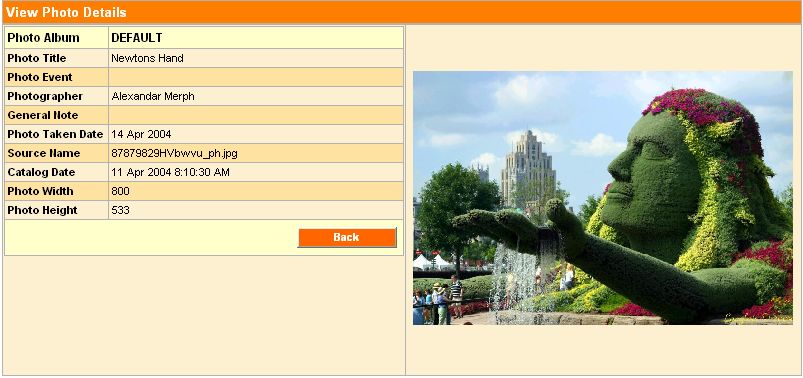
  • Photo
    • Virtual gallery
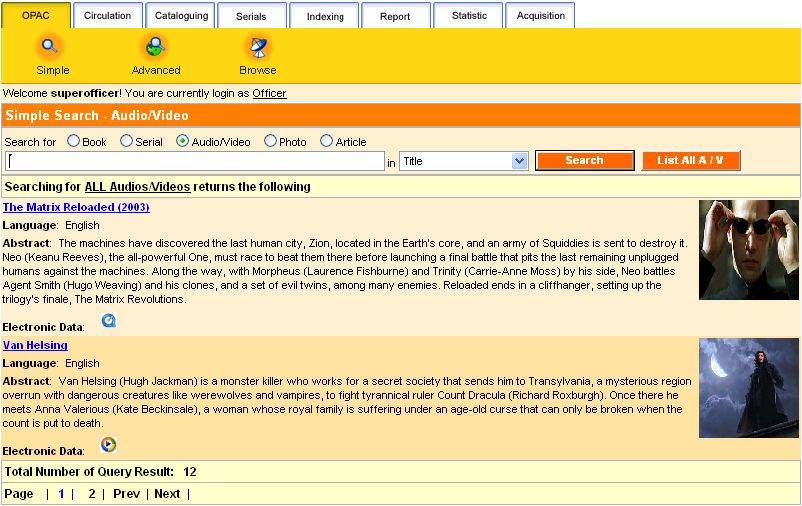
  • Audio/Video
    • Media accessing
  • Article
    • Press cutting
    • Journal indexing
  • Multilingual


4) Circulation
  • Book & Serial Circulation
  • Loan
  • Return
  • Extend
  • Reserve
  • Patron current activities
  • Patron transaction history
  • Overdue warning
  • Circulation limit control
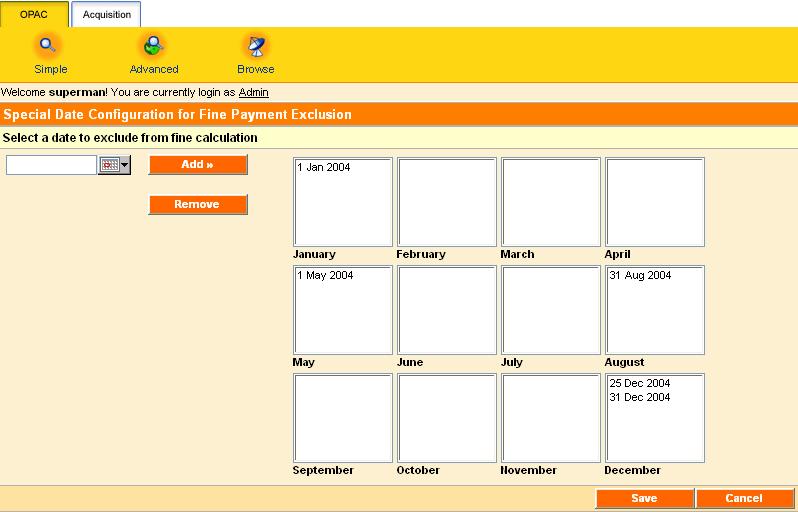
  • Fine payment management
  • Fine limit control
  • User-friendly circulation mode switching control
  • Configurable circulation rules and regulation

5) Self Circulation
  • Allow patrons to perform circulation functions with restricted rules
  • Self-checking current activities
  • Self-revised transaction track records
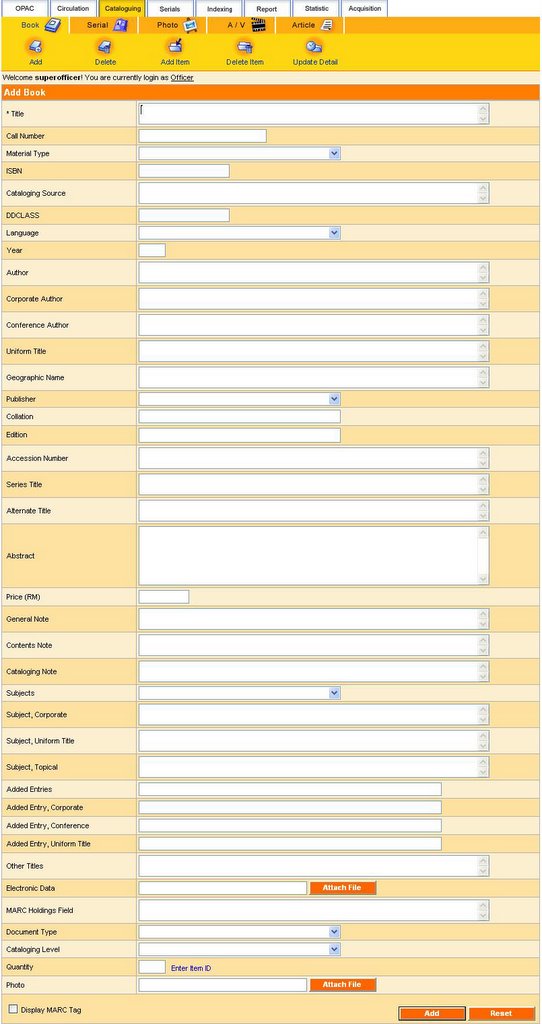
6) Cataloguing
  • Catalog management
  • Catalog item details
  • Barcode-enabled
  • Configurable cataloging fields selection

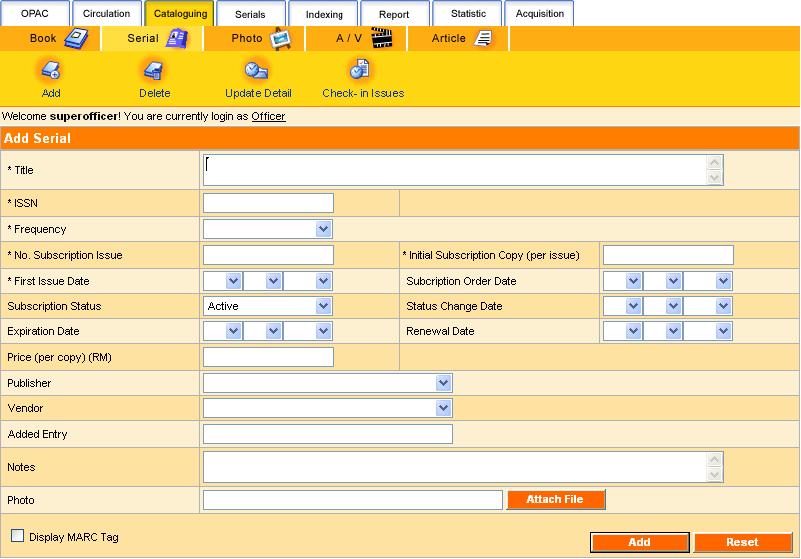
7) Serial Cataloguing
  • Catalog management
  • Catalog item details
  • Barcode-enabled

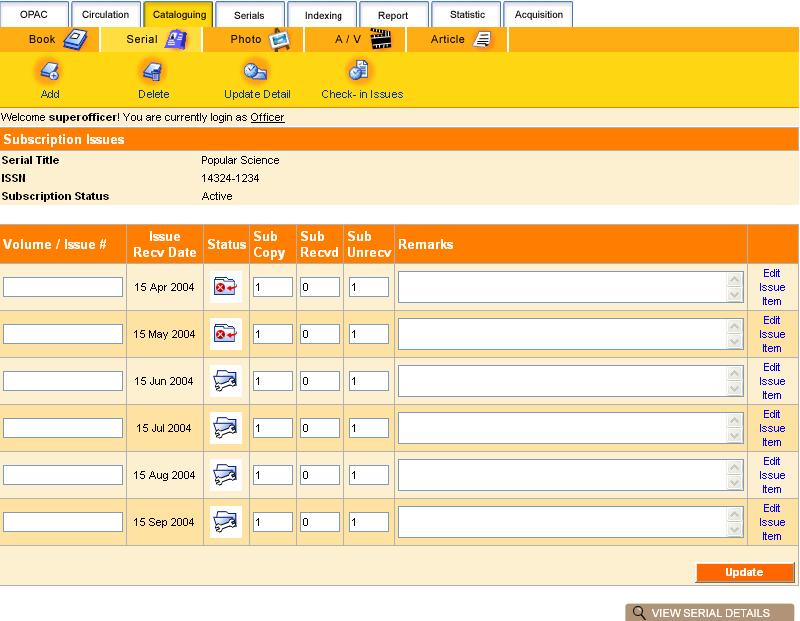
8) Periodical
  • Allow check-in and check-out for serial subscription
  • Prediction of subscription arrival date
  • Incomplete/undelivered collection reminder

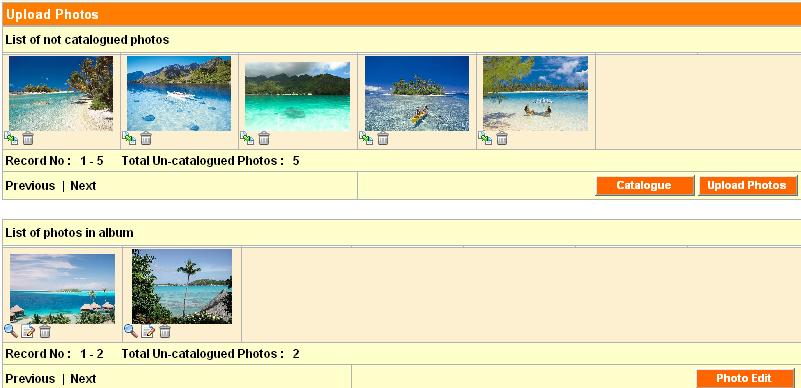
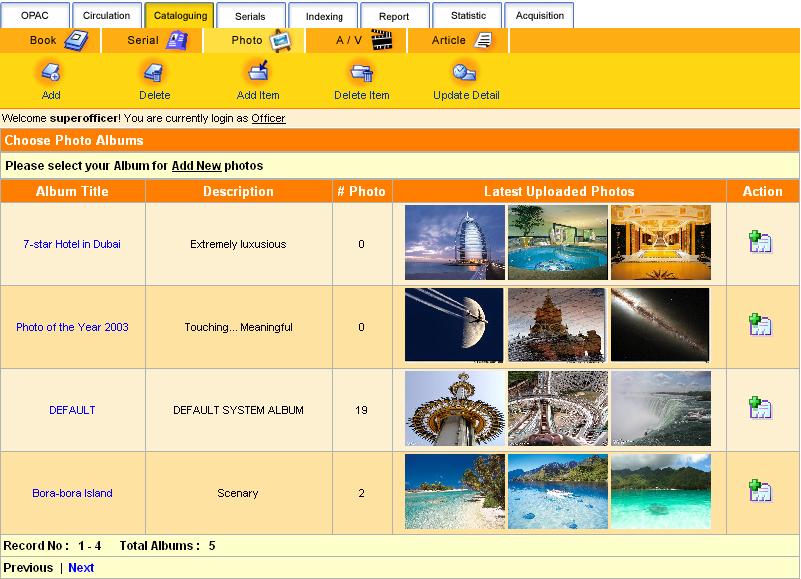
9)
Photo Cataloguing
  • Catalog management
  • Catalog photo details
  • Album collection
  • Photo gallery


10) Audio / Video Cataloguing
  • Catalog management
  • Catalog item details
  • Media accessing
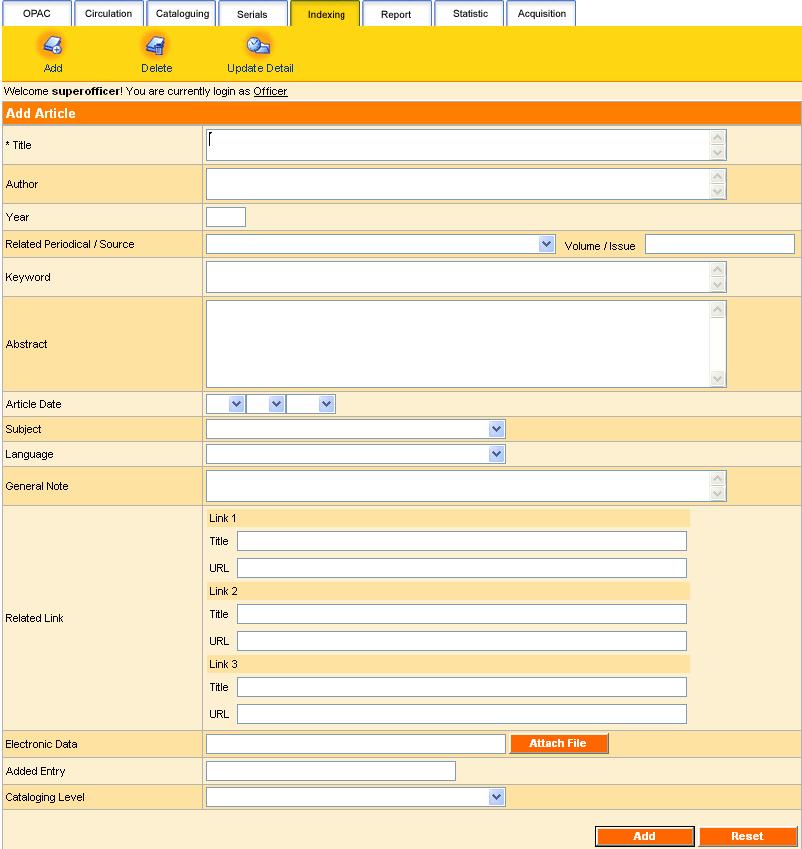
11) Indexing
  • Index article
  • Direct link to source / periodical

12) Configuration
  • Configure system access level/user type
  • Configure circulation rules and regulation
  • Configure cataloguing field options
  • Configure web links
13) Patron Management
  • Manage patron profile
  • Add
  • Delete
  • Update
  • Search
14) Personalization
  • User profile self-update
  • Change password
  • Personalized search result preference

15)Vendor Management
  • Manage vendor profile
  • Search vendor profile
  • Integrated vendor expenses control
16) Administrative Management
  • Sign up / delete administrative user
  • Manage administrative user profile
  • Search administrative user profile
17) Report
  • Patron report
  • Serial report
  • Dynamic Boolean Book Printable Report
  • Dynamic Circulation Book Printable Report
18) Statistics
  • Dynamic statistics report management
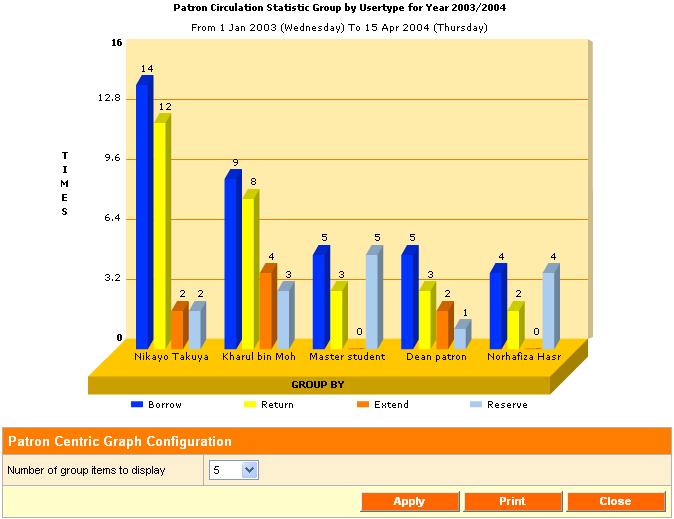
  • Circulation statistics
    • Patron centric
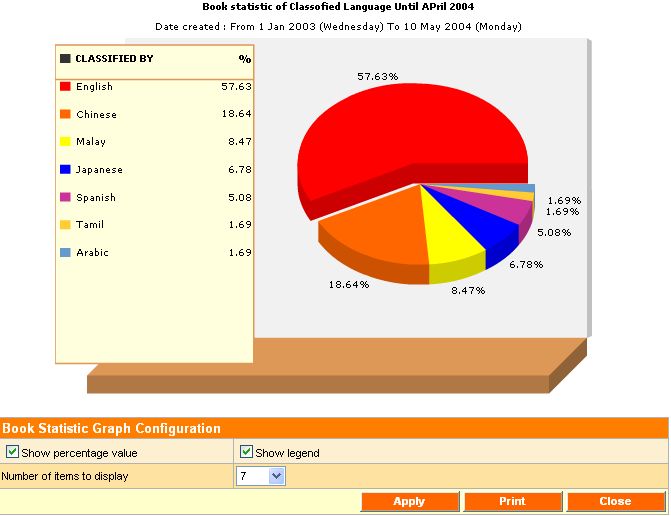
    • Book centric
  • Book statistics
  • Advance printable 3D animated analysis graph


19) Acquisition
  • Order / Wish List management
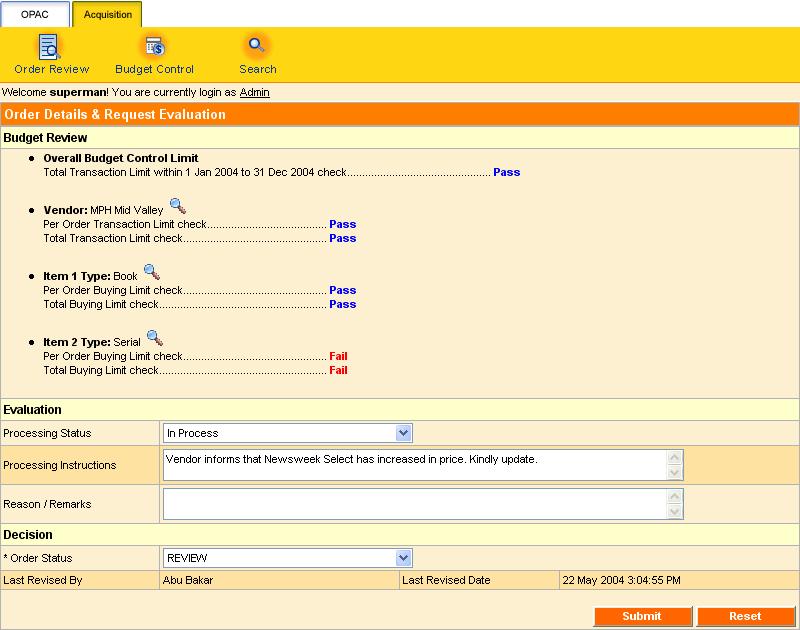
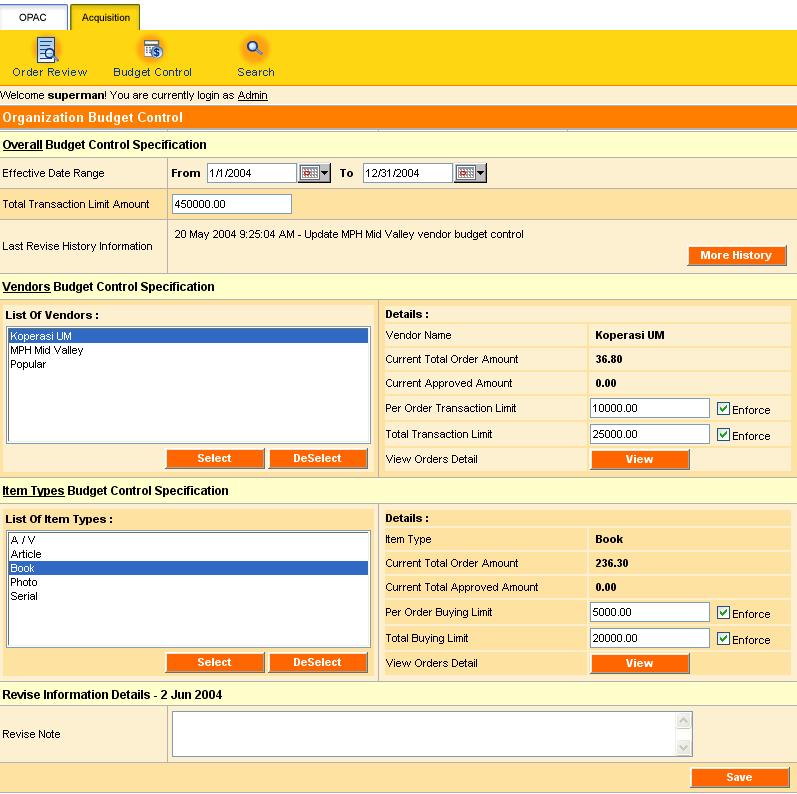
  • Vendor / Materials budget control
  • Auto evaluation engine
  • Order search

We believe that our professional software developers and experienced librarians, and ever-evolving suite of services, would be able to cater and support your library’s needs.

Image Understanding (IU)

Throughout these years, the growth of digital media collections has been accelerating, particularly in still images. These artifacts repre...