Throughout these years, the growth of digital media collections has been accelerating, particularly in still images. These artifacts represent huge quantity of heterogeneous information and it is not easy to be managed. Thus, there is a need for the development of human-centered tools for an efficient access and retrieval of them. The capability of current imaging systems have just focused on low-level visual context processing of the images and still limited to describe the high-level semantic conceptualization. The aim of this research is to investigate methods to enable a machine to understand the content of an image at the conceptual level.
Module: Multiple Features-Object Conceptualization
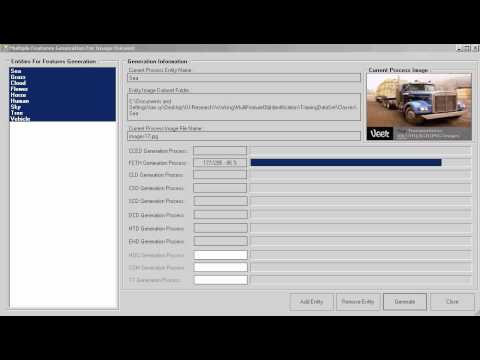
The aim of this research is to investigate existing pixel level processing methods that can be used in isolation or in combination to extract various types of low-level information (i.e. Image Feature Descriptors) from an image. Also, the research is to investigate a suitable data model that will effectively link these feature descriptors to a specific object. The proposed data model is encouraged to be designed as in a form of ontology, thus to leverage the nature intelligent underlying by the class hierarchy. Diagram shows the feature conceptualization process performed by the Proof-of-Concept (POC) system.
Module: Multiple Entities Recognition via Case-base Analysis
The aim of this research is to investigate and develop a suitable technique to map the conceptualized feature descriptors in previous described module to a specific content in image. Feature-object Ontology will be served as a 'brain' for recognizing and identifying entities in the image. Multiple parts of an input image are being accessed for feature extraction process. The extracted features are used as source to compare with the pre-trained features. Diagram shows the POC simulation of multiple parts of image accessing process and the case-based object recognition process.
Module: Object Spatial Relationship Extraction
The aim of this module is to conduct research to formulate suitable techniques for constructing spatial relationship among the objects in an image. Spatial information between objects in an image plays an important role in image understanding process. For example, if there are cars on top of a road, and there are people stands besides the cars, the image might carry the meaning of certain specific event, such as road accident or car exhibition. With this spatial information, in combination with other additional prior knowledge retrieved, we hope to enable a machine to achieve certain level of understanding on an image.
Module: Semantic Image Interpreter via Conceptual Graph
The aim of this module is to investigate and develop techniques to interpret an image by constructing a conceptual graph as the representation of the image content. All of the entities detected from the previous described modules are able to be linked together and represented in a form graph. Investigation effort continue to develop graph processing techniques such as combine, delete and project to further enrich these constructed graphs. The graph data can also be served as an input to another system for further analysis in order to obtain useful knowledge.